

In memory of my friend and business partner, Paul Wegener, who taught me the meaning of “alles mit der Ruhe”.
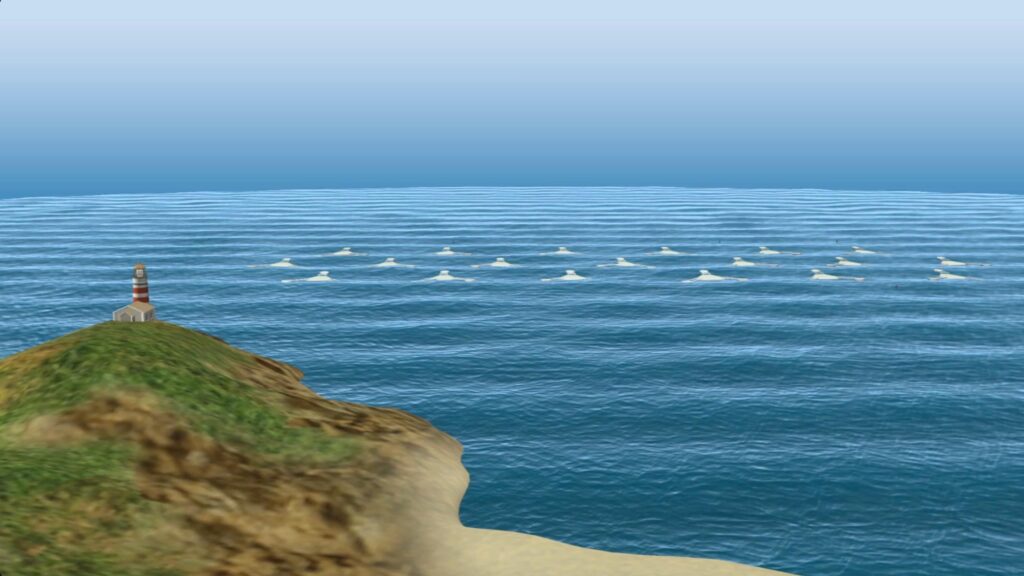
“Everyone seems to think that putting electric generators in the middle of the ocean is a good idea, but it makes no sense.”
Paul explained his idea to me in our first meeting. An intelligent gentleman in his 70s with an M.S. in Environmental Engineering from Johns Hopkins and a B.S. in Applied Science and Engineering from CalTech, he had reached out to me through a mutual connection after discovering my background in scientific computing from LinkedIn. Backed by a federal research grant, Paul had commissioned the National Renewable Energy Laboratory to build a hydrodynamic simulation of an ocean wave energy converter called the “Waveberg.” The simulation code was being written in Python, but with far more savvy in Excel than in object-oriented programming, Paul needed help using it. I knew I could help him with his Python simulations and agreed to a consulting arrangement.
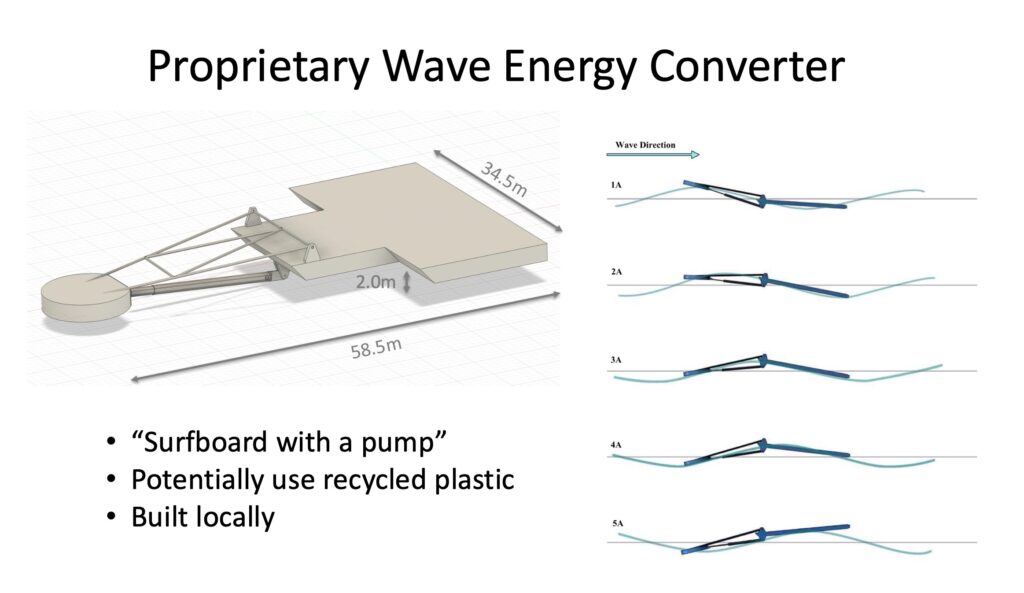
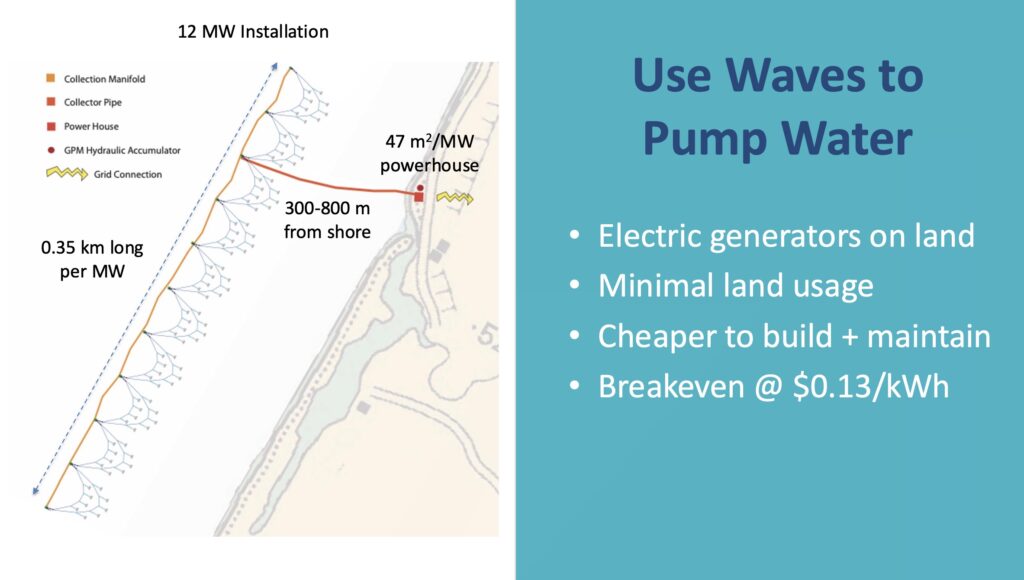
The device featured two large foam platforms coated in fiberglass (like two giant surfboards), connected by a lever arm and linear pump. With each passing wave, the two platforms would heave and pitch, compressing the pump and pushing saltwater at 800 PSI through a network of flexible underwater pipes back to shore. An onshore Pelton turbine would convert the high-pressure flow into electricity. A series of industrial wellbore pistons would act as accumulators to smooth out the fluctuations in pressure between wave sets. Out in the water, entire fleets of wave energy converters would connect in a modular web of mooring lines. Each array of nine Wavebergs would be held in place by two anchors.
That was Paul’s idea: “Instead of generating electricity in the ocean, surrounded by saltwater, we should use ocean waves to pump water back to shore where we can generate electricity on dry land. Not ocean power, but rather ocean hydro power.”
After two months of collaborating with scientists at NREL on the requirements for the simulation code, I discovered that Paul was looking for someone to partner with him long term. He had been shepherding the development of this concept single-handedly for over 20 years, ever since his co-inventor had passed away. Determined to give something good to the world and to honor the memory of his friend, Paul had successfully navigated two federal grant applications, mechanical engineering analysis contracts, laboratory tests at international wave tank facilities, and the construction of two functional scaled prototypes by himself.
He had also accumulated hundreds of Excel files, PDFs, word documents, photos, diagrams, and reports from his various iterations over the years. I started by reviewing the most important documents, along with some industry standards in wave tank testing compiled by various government agencies in the USA, EU, and UK. I examined his cost projections and conducted preliminary financial modeling to determine a ballpark price-per-kilowatt-hour that an installation would require in order to be profitable. From this cursory analysis, I determined that the project was worth exploring in more detail.
Starting a Business
After a month of conducting my own due diligence and reviewing Paul’s data, I decided to go into business with Paul in January, 2025. I gave myself a deadline of six months for us to build out our business plan and obtain angel/seed funding, figuring that if we didn’t have a strong investment signal by then, it would probably be wise to pivot. I suggested the name “Nearshore Ocean Wave Renewables” or “NOW Renewables” for short since the wave energy converter was designed for nearshore operation and humanity’s need for this was urgent.
I immediately sought out a SCORE mentor (Service Core Of Retired Executives) who had worked at the Department of Energy and had managed businesses installing nuclear power plants in the USA and South America. His input was invaluable to me, particularly in identifying my own strategic blind spots. I charted a course for developing a business plan, pro forma, and pitch deck that we could use to identify how much money we needed to raise and obtain funding from interested investors.
Costs and Alternatives
The first step in identifying our target funding level was to hone our cost and revenue estimates. I researched multiple vendors of foam, plastic, fiberglass, and steel to estimate raw material costs. I built Python and Excel models of the device to compute manufacturing costs at any device scale. At the same time, I learned Autodesk Fusion so that I could build a CAD model of the Waveberg for generating alternative material cost estimates and identifying mechanical failure modes.
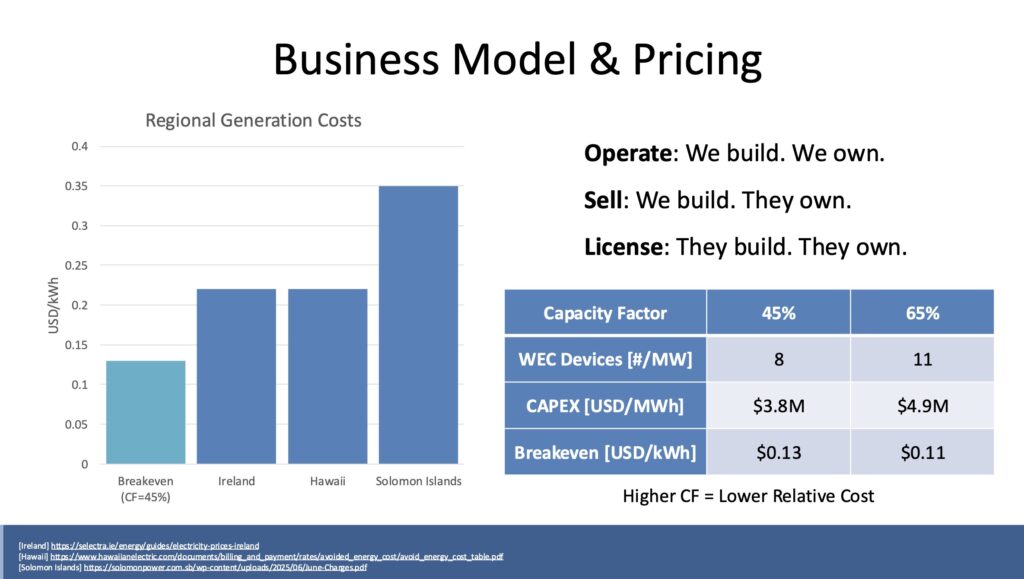
By far, the most tedious challenge was extracting costs of electricity generation from dozens of public and private utilities across our target market. Electric companies in many countries are required to report breakdowns of the costs that they pass on to consumers, but even in the most developed and best-regulated countries these cost breakdowns manage to obscure the generation fees that utilities pay to power plant owners. After reading through energy rate schedules, financial statements, and marketing material from over 50 different utility companies, I managed to find publications from the U.S. Energy Information Administration and the Ireland 2050 Energy Institute that indicated generation costs fall between 55% and 62% of consumer electricity costs. This proportion served as my model for generation costs worldwide, allowing me to compute an average cost-per-kilowatt-hour that a power plant owner could expect to earn in each of the 36 coastal markets we would address.
In developed countries, renewable energy provider often charge a premium for their electricity. They have benefited from (and dare I say, depended on) the numerous subsidies and policy incentives of the past 25 years. The problem is that when policies change, so does the financial feasibility of the renewable energy plant. I was convinced, and still am, that renewable energy will supplant fossil fuels only when it makes better economic sense (or rather, cents) to consumers. The only lasting way to make renewable energy ubiquitous is to make it cheaper.
Strategically, this meant we needed to target markets with the highest costs of electricity generation — either due to limited land availability for power plants, or due to lack of natural oil resources, or due to high import costs. As it turns out, islands in the Pacific and Atlantic oceans tend to fit all three qualifications. Some of the most expensive electricity on earth comes from places like Solomon Islands, the Federated States of Micronesia, Hawaii, and the US Virgin Islands. These places rely on burning expensive imported fuel because they don’t have enough suitable locations for wind, solar, hydro, or nuclear power. What they do have in abundance are ocean waves.
A Powerful Idea
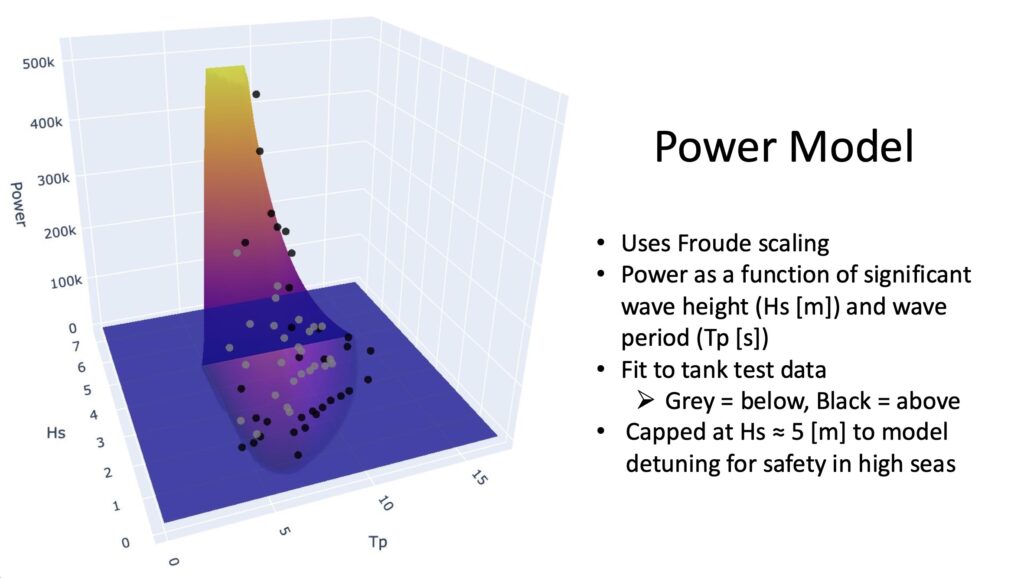
To model the power output of the system, I relied on lab data that Paul had gathered at Stevens Institute and the HMRC wave tanks during testing of earlier prototypes. The data include power output measurements (water pumped per minute through a tube with preset height/head) for various wave periods and wave heights. I examined this data using Python’s matplotlib and plotly libraries, fitting piecewise functional forms in two dimensions using a least squares objective function to interpolate a power output surface over wave period and wave height. I then used Froude scaling laws to extrapolate the power output to larger device sizes. This empirical power output model enabled me to compute the Waveberg’s power output for any sized device in any ocean wave state. It also let me determine average power outputs for any installation site with available wave state distribution data.
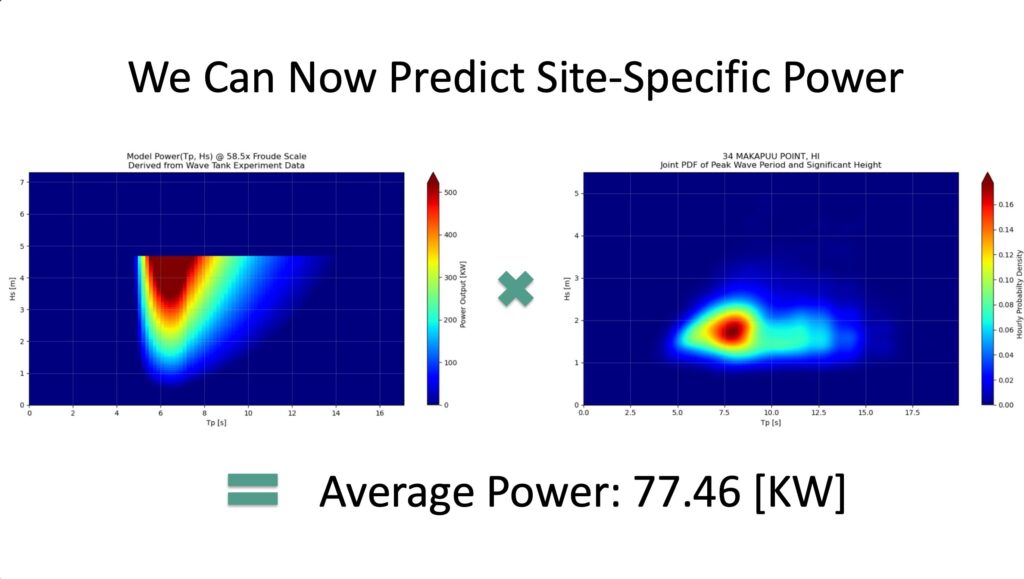
After searching through dozens of online databases, I found the Coastal Data Information Program (CDIP) publicly available on a UC San Diego website. I wrote Python scripts to extract CDIP wave state distribution data for over 150 coastal sites worldwide. I then fitted kernel density estimates to the data, allowing me to interpolate wave state distributions continuously, and normalized the two-dimensional joint distributions to integrate to one. I multiplied our device’s power output matrix by each site’s wave state distribution (Frobenius inner product) to arrive at the average annual power output for each site. I iterated this process over many device scales, allowing me to optimize the device scale to maximize power output, essentially “tuning” our WEC’s length to match the most prominent wave conditions of a given region.
Project Feasibility
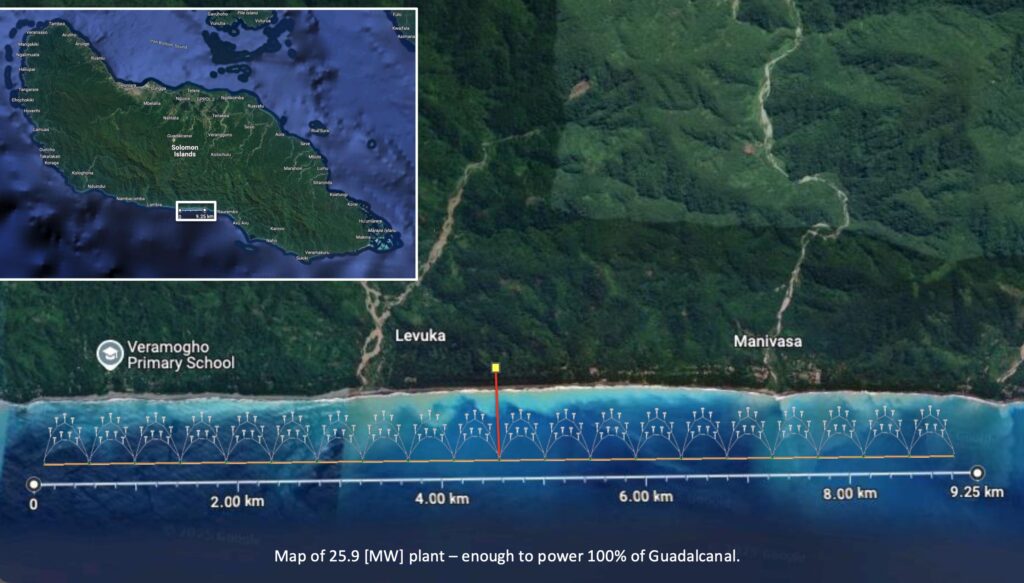
I poured through nautical charts looking for viable installation sites and used Google Maps to measure the lengths of each island’s coastline. I focused on locations exposed to deep sea winds and situated either in underpopulated or underutilized areas (for example, near airports). In many of these regions, rural communities survived without electricity, refrigeration, and lighting.
Using my power output model and some demographic data published by public energy utilities, I was able to estimate how many Wavebergs could be installed at each of 36 locations. In turn, this enabled me to estimate a serviceable addressable market of $1.1 billion for islands and $10.5 billion for continental coastlines.
I was thrilled to see that in many island nations, we could supply 100% of their present-day electricity consumption using a fraction of available coastline. On larger islands with a greater population-to-coastline ratio like Hawaii, Guam, or Barbados, we could supply up to 8.6 % of consumption using less than 5% of their viable coastline. We could still make a dent in fossil fuel usage while lowering the consumer’s monthly electricity bill.
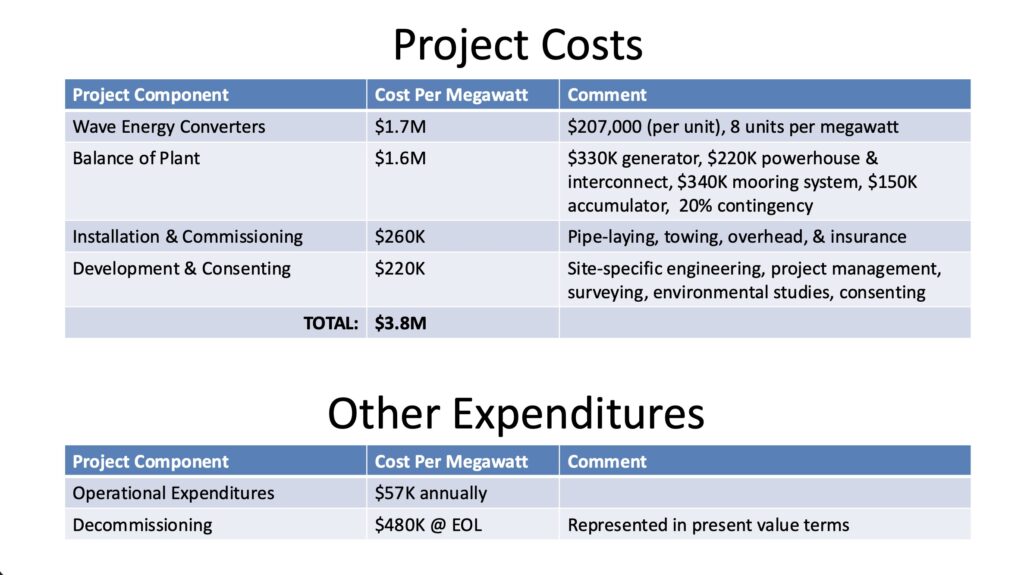
To properly convey the opportunity to potential investors, we needed a way to measure the financial risks and potential payoffs. I modeled economic assumptions (bond rates, risk-free rates, inflation, project financing premia typical for wind/solar projects in the US and Europe) using historical data and computed a present value annuity factor, which simplified many subsequent calculations. I conducted bottom-up and top-down estimates of manufacturing, balance of plant, installation, commissioning, development, and consenting capital expenditures, as well as operational and end-of-life decommissioning expenses. For each of the model assumptions, I listed two or three sources and wrote an explanation for the reasoning behind that assumption. I then averaged the results from the bottom-up and top-down analyses to arrive at my final project cost estimates for each cost center.
I read through various IRS publications to determine the proper amortization and depreciation schedules for each capital expense. I had previously learned some accrual accounting methods from an earlier startup, but I learned how to create cash flow statements and match them against balance/income statements while working on NOW Renewables so that I could model the 25-year performance of any power plant installation. This included a 4-year period of site surveying, financing, breaking ground, and installing, plus decommissioning at the end of operation. My SCORE mentor validated my model, stating that some of the construction timelines would likely be shorter once we had completed our first few projects.
After writing Excel formulas to update my 25-year pro forma automatically, I included annual performance metrics: debt-to-assets, debt-to-equity, debt service coverage, net profit margin, operating profit margin, return on assets, return on equity, and present value of return on equity. This allowed me to compute the investment payback period for a power plant of any size in any region.
I also conducted a price sensitivity analysis by manually adjusting different costs-per-kilowatt-hour and recording how the financial metrics changed depending on the sale price of electricity. In the cheapest and most competitive markets, a power plant owner could expect to make back their investment within 12 years of the plan coming online; in the most expensive markets with the fewest alternatives, they would make back their investment within three years. In all of these cases, I assumed that the renewable energy generated by our system would be sold at the current fossil fuel energy price or lower and that we would never have access to government subsidies, feed-in-tariffs, or volume-based cost savings.
Building the Proposal
Despite there being a path to profitability, this investment still posed plenty of risks. For one, the technological risk of developing a novel wave energy converter must not be understated: in the history of usable electricity, nobody has yet invented an ocean wave energy generator that can survive the harsh marine environment while costing less than land-based solutions. Many have tried, but the one big reason why they have not yet replaced fossil fuels is because they are so expensive to build, install, and maintain.
Paul was an evergreen optimist; I took it upon myself to adopt the risk-averse investor’s mindset. Together, we made a well-balanced team. Still, there were so many engineering details to be worked out — from mechanical durability to seaworthiness, to material UV resistance, to the nuances of sourcing a saltwater Pelton turbine and saltwater linear pump, to simulation/modeling constraints and control algorithms, to industrial engineering of the powerhouse infrastructure… and every detail would be critical for the long-term success of the project. This proposal would not be an appropriate match for the risk profile of most investors; it would require a mission-oriented firm with an understanding of the risk that goes into developing renewable energy technologies.
Additionally, we wanted to avoid following in the wake of other wave energy companies that had raised millions for R&D, but not enough for commercialization. At my SCORE mentor’s suggestion, my business partner and I agreed that we ought to raise enough money to operationalize our first power plant: a physical, grid-connected proof of profitability.
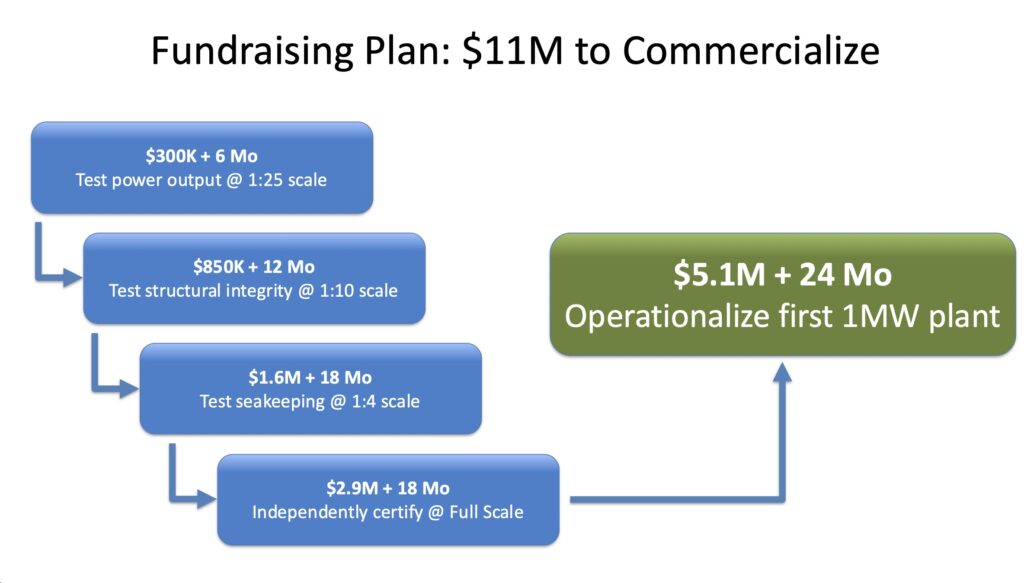
I mapped out a development strategy to take us from optimizing our 1:25 scale prototype all the way up to operationalizing our first one-megawatt installation, using Holmes’s 2009 publication on Tank Testing of Wave Energy Conversion Systems as a guide. Together, Paul and I planned where we would conduct each phase of testing, what the development objectives and device requirements would be, and how we would handle contingencies. I also developed our staffing strategy, identifying who we would need to hire in each stage and incorporating the overhead costs into our pro forma.
When all was said and done, we had a plan to deliver the world’s first NOW Renewables power plant for $11 million in seven years. For comparison, the Pelamis project raised $40 to $60 million in the early 2000s before grinding to a halt, and CorPower has raised over $120 million in its 14 years of development. CorPower is still undergoing ocean testing.
Our advantage? Keeping the generators on dry land and using cheap, highly buoyant material to harvest energy from waves.
In Search of Funding
I scoured the internet for every publicly available investor database I could find. I poured through podcasts, blogs, brochures, news articles, competitor press releases — anywhere I could find information on potential investors. I aggregated databases from a handful of different sources, compiling a cleaned list of roughly 18,000 investors worldwide. I then filtered the data for investors in energy, industry, and climate change. This yielded a list of 700 firms that might be interested in our proposal. After manually reading through each firm’s investment thesis, I narrowed the list down to 200 firms that would be a good fit.
In one month, I reached out to those 200 different investment firms across the US, EU, and UK. Two of them expressed an interest, and I ended up pitching to both of them. The first one never got back to us after our initial presentation, but the other one was very interested. Unfortunately, that second investor’s firm had a policy of not leading rounds; they would only be willing to partner with us if we could find another investor to lead the round.
A New Horizon
By this point, it was now the end of July. We had hit my personal “stop loss”. At the same time, pressures on the global economy, the AI investing blitz, and changes in policy direction from the White House all indicated strong headwinds for renewable energy hardware startups like ours. I had so greatly looked forward to the possibility of building something good — something needed — and creating numerous jobs in the processes. The previous six months of modeling and planning had convinced me that this idea was worth pursuing. I’m glad we did, even though it was now time for me to move on. Paul understood my need to do so, and was characteristically generous in his appreciation for my work on this project.
Three months later, in October of 2025, my friend Paul passed away.
There was a lot to this career, but it all started with Paul’s intense interest in scientific ideas, and a burning desire to see those actually reach the people who would benefit from them. This attitude made him invaluable, and indeed lovable, to the inventors fortunate to encounter him. For Paul would in effect put their inventions on his back and carry them as far as he could – without any limit to his commitment of time, energy or his own financial resources.
~ Andrew Munro, read on behalf of Brenda Wegener at Paul’s Sukhavati – October 23, 2025
I share this story partially to document my involvement in the adventure that was NOW Renewables, but also to serve as an ember of the torch Paul carried for the work of his departed friend. Paul cared deeply about helping future generations navigate climate change. He cared deeply about honoring the memory of the inventors who had gifted their hopeful light to the world.
Perhaps this ember will one day ignite a new flame.